Building on yesterday’s What is whole life insurance and how does it work? I wanted to dig a deeper into dividends since they’re the reason one would invest in a whole life policy.
So what goes into a dividend? Guardian Life explains how their dividends basically boil down to three core business disciplines:
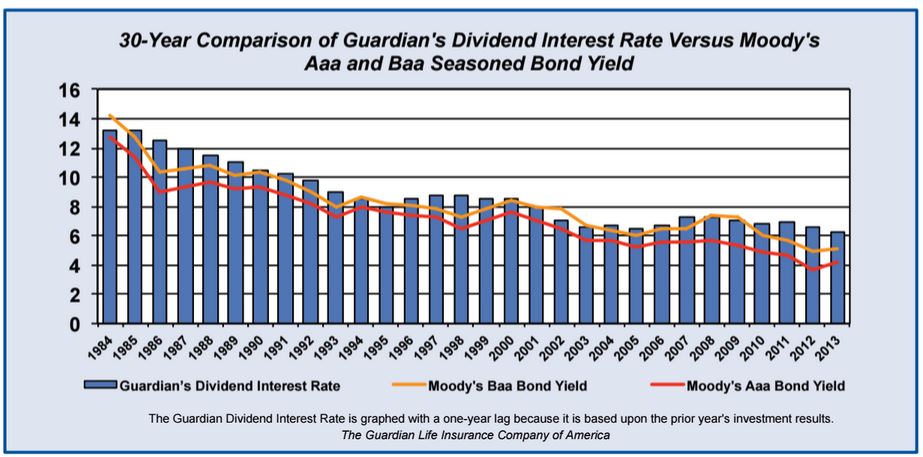
Investment results Strong investment results mean that the company is able to prudently manage a well-diversified, high-quality asset portfolio that backs its long-term obligations. Investment income earned in excess of the guaranteed interest rate comprises part of the dividend. These investment results are represented as the Dividend Interest Rate (DIR).
Mortality experience The company has good mortality experience if the number of death claims paid is less than the mortality assumptions used to provide the guarantees in whole life policies. The difference between actual experience and the guaranteed mortality in the policy is returned to the policyholder as part of the dividend.
Expense management If the company’s expenses are lower than anticipated, those savings also help to support a more favorable dividend that year. Expenses are carefully monitored and controlled.
More simply, a large component of how dividend rates are determined is tied to that insurance company’s investment performance, which is mostly locked into safe securities such as long term bonds. And safe securities haven’t performed as well over the last couple decades because they are closely tied to these interest rates.
Guardian Whole Life Insurance dividend History (since 1984)
My life insurance policy is through Guardian, who announces their dividend rates every November. The average return on dividend rates from Guardian Life over the last 30 years (1982-2012) was 8.98%.
Here’s an updated chart capturing the current 30 year period (1984-2015)
Having trouble differentiating the small fluctuations year-to-year? Me too, so here’s Guardian’s dividend percentage history for the last ten years:
| Year | Rate | Dividend (in millions) |
|---|---|---|
| 2015 | 6.05% | $784 |
| 2014 | 6.25% | |
| 2013 | 6.65% | |
| 2012 | 6.95% | $805 |
| 2011 | 6.85% | $795 |
| 2010 | 7.00% | $740 |
| 2009 | 7.30% | $712 |
| 2008 | 7.25% | $723 |
| 2007 | 6.75% | |
| 2006 | 6.50% | |
| 2005 | 6.75% |
For seven of the last ten years, Guardian’s dividend rate has hovered between 6.75 and 7.30. 2014 (6.25) and 2015 (6.05) saw two consecutive years of the lowest rates in Guardian’s history — not the best timing to get in, but hopefully those rates improve going forward.
Comparing Whole Life Policy Dividend Rates
With several big name, reputable players in the game including Guardian, New York Life, Metlife, Mass Mutual, Sunlife, John Hancock and Northwestern — it isn’t an easy to navigate the whole life landscape.
There are several considerations — such as fees, reputation, customer support, and stability, but for the sake of comparing data, we’ll focus on the return rates for the top 11 insurance companies.

Guardian still has one of the highest dividends in the industry, but they used to always have the highest rates in the industry until the mid-1990’s when Mass Mutual started consistently surpassing Guardian.
Now Mass Mutual is the only large insurance provider to have dividend rates over 7%. And the once-mighty Guardian is barely hovering above 6% (but still in second best in the industry overall).
Obviously that’s something to track if you’re considering whole life insurance as an investment product.